๊Update Property Sector Break 300
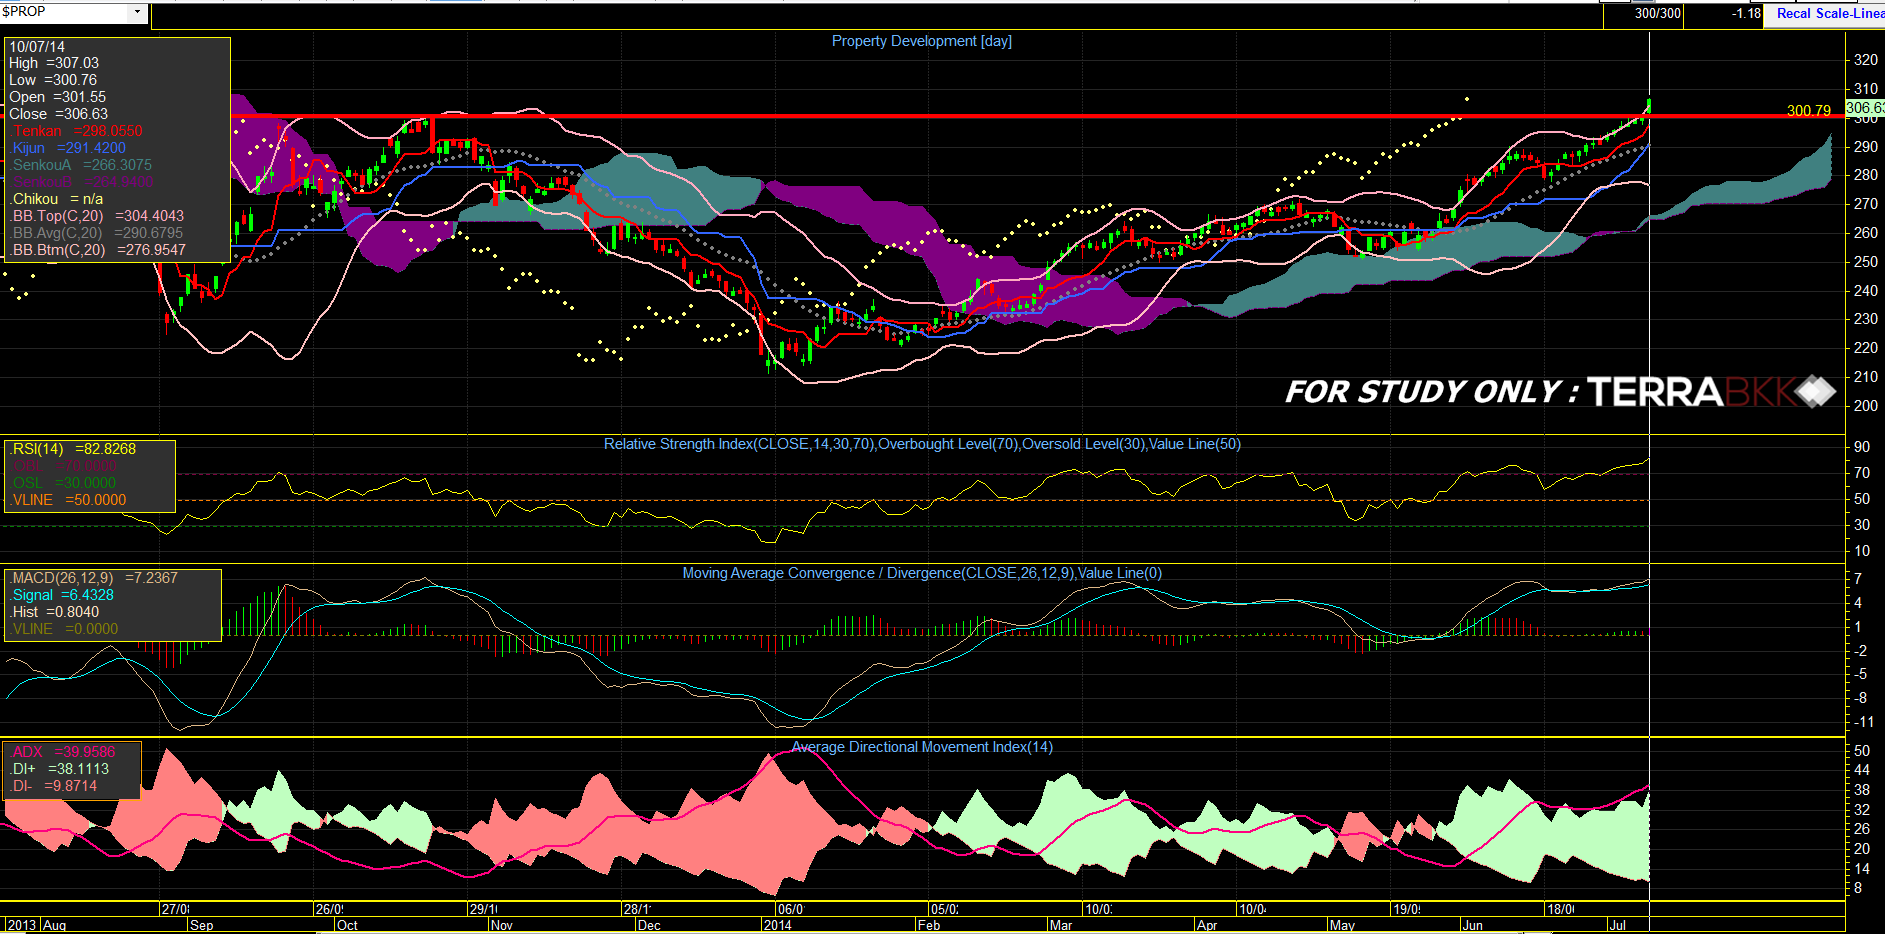
TerraBKK Research ติดตามสถานการณ์หุ้น โดยเมื่อวันศุกร์ที่ผ่านมากลุ่ม Property ปรับตัวทะลุ 300 จุด สูงสุดในรอบ 1 ปี ปรับตัวโดดเด่นในตลาดซื้อขายหลักทรัพย์ (SET) มาปิดที่ 306.63 จุด โดยทำจุดสูงสุดตั้งแต่มีการปรับลงตัวในช่วง กลางเดือน 2556 ที่ผ่านมา
ในเชิงการวิเคราะห์ทางเทคนิคการปรับตัวทะลุแนวต้าน 300 จุด ซึ่งเป็นแนวจิตวิทยาที่สำคัญถือเป็นสัญญาณที่ดีในกลุ่มนี้ อีกทั้ง ในกราฟวัน แท่งเทียนในวันศุกร์ทะลุกรอบ Bollinger Band Top ขึ้นมาได้ ส่วน RSI อยู่ที่ 82.8268 อยู่ใน อยู่ในเขต Overbought ซึ่งอาจจะมีการพักตัวของดัชนีในระยะเวลาใกล้ๆนี้และ ADX อยู่ที่39 แสดงถึงเทรนขาขึ้นที่แข็งแรง

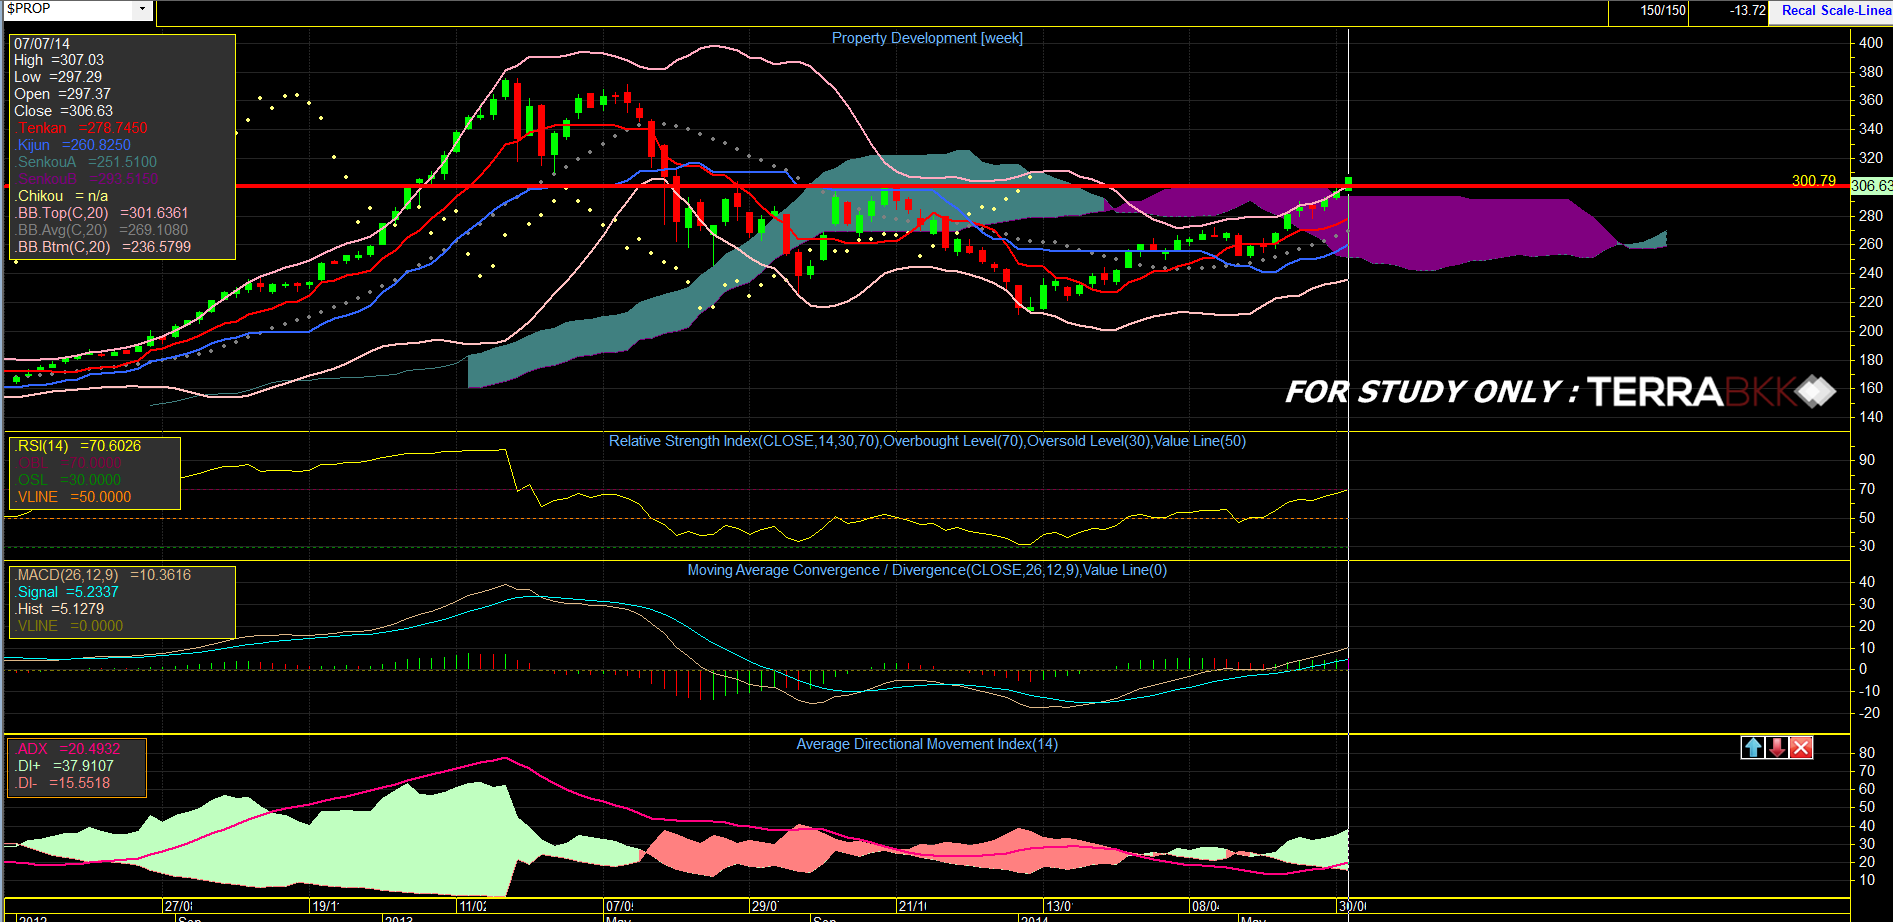
ภาพรวมในระยะยาวไม่ได้เปลี่ยนแปลงจากการวิเคราะห์ในครั้งที่แล้วมากนัก มีสิ่งที่เฝ้าระวังเพียงอย่างเดียวคือ RSI ที่อยู่ใน เขต Overbought ที่มากกว่า 70 ปัจจุบันอยู่ที่ 70.6026 อาจจะมีแรงขายเทออกมาได้

ในภาพรวม TerraBKK Research มองว่า ดัชนีกลุ่ม Property ยังไม่มีสัญญาณกลับตัวเป็นขาลงทั้งในระยะสั้น (Day) และระยะยาว (week)
“การลงทุนมีความเสี่ยง ผู้ลงทุนควรศึกษาข้อมูลก่อนการตัดสินใจลงทุน”
Indicator definition by investopedia. Moving Average Convergence Divergence – MACD : “A trend-following momentum indicator that shows the relationship between two moving averages of prices. The MACD is calculated by subtracting the 26-day exponential moving average (EMA) from the 12-day EMA. A nine-day EMA of the MACD, called the "signal line", is then plotted on top of the MACD, functioning as a trigger for buy and sell signals.” Relative Strength Index - RSI : “A technical momentum indicator that compares the magnitude of recent gains to recent losses in an attempt to determine overbought and oversold conditions of an asset.” Average Directional Index – ADX : “An indicator used in technical analysis as an objective value for the strength of trend. ADX is non-directional so it will quantify a trend's strength regardless of whether it is up or down. ADX is usually plotted in a chart window along with two lines known as the DMI (Directional Movement Indicators). ADX is derived from the relationship of the DMI lines.”


